故障分析 | 如何解决由触发器导致 MySQL 内存溢出?

作者:龚唐杰,爱可生 DBA 团队成员,主要负责 MySQL 技术支持,擅长 MySQL、PG、国产数据库。
爱可生开源社区出品,原创内容未经授权不得随意使用,转载请联系小编并注明来源。
本文约 1500 字,预计阅读需要 5 分钟。
作者:龚唐杰,爱可生 DBA 团队成员,主要负责 MySQL 技术支持,擅长 MySQL、PG、国产数据库。
爱可生开源社区出品,原创内容未经授权不得随意使用,转载请联系小编并注明来源。
本文约 1500 字,预计阅读需要 5 分钟。
1问题现象
一台从库服务器的内存使用率持续上升,最终导致 MySQL 服务被 kill 了。
内存监控视图如下:
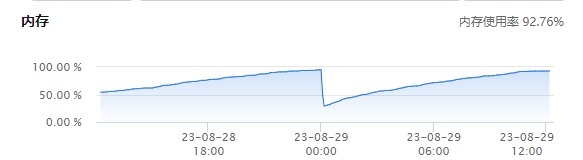
从图中可以看出,在 00:00 左右触发了 kill,然后又被 mysqld_safe 进程拉起,然后内存又会持续上升。
2排查过程
基本信息
-
数据库版本:MySQL 5.7.32 -
操作系统版本:Ubuntu 20.04 -
主机配置:8C64GB -
innodb_buffer_pool_size:8G
由于用户环境未打开内存相关的监控,所以在 my.cnf 配置文件中配置如下:
performance-schema-instrument = 'memory/% = COUNTED'
打开内存监控等待运行一段时间后,相关视图查询如下:
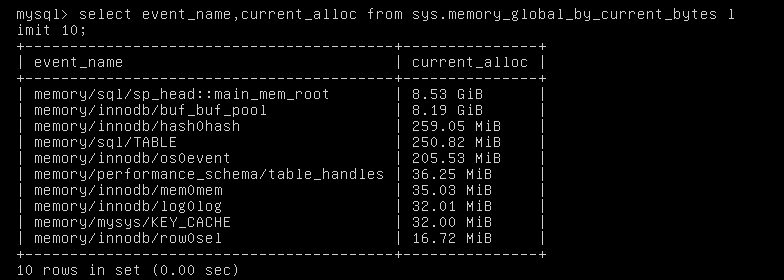
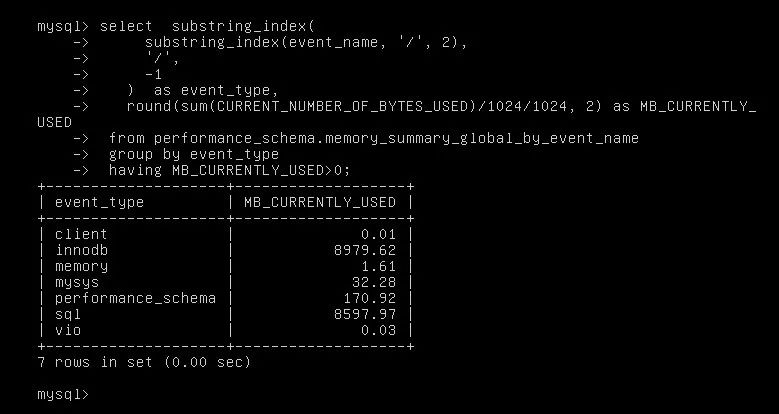
从上述截图可以看到,MySQL 的 buffer pool 大小分配正常,但是 memory/sql/sp_head::main_mem_root 占用了 8GB 内存。
查看 源代码[1] 的介绍:
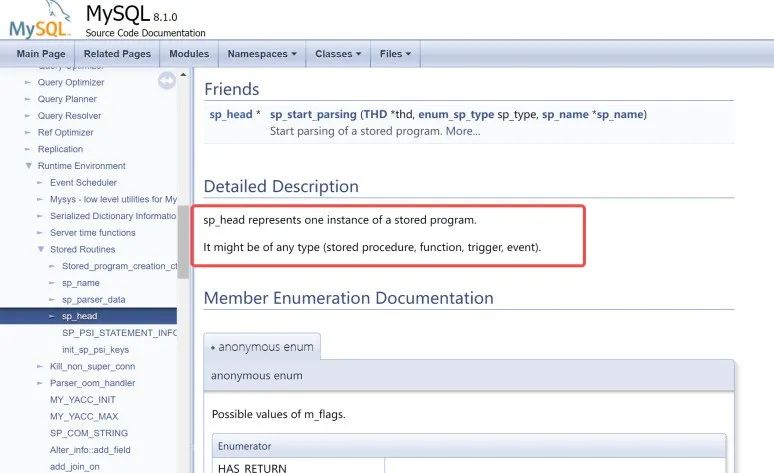
sp_head:sp_head represents one instance of a stored program.It might be of any type (stored procedure, function, trigger, event).
根据源码的描述可知,sp_head 表示一个存储程序的实例,该实例可能是存储过程、函数、触发器或者定时任务。
查询当前环境存储过程与触发器数量:
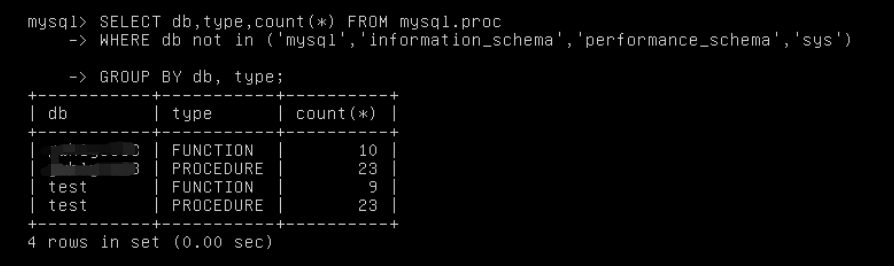
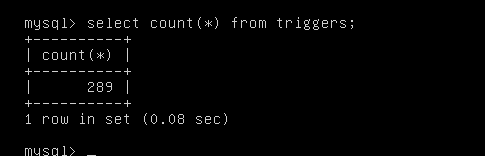
当前环境存在大量的触发器与存储过程。
查询 MySQL 相关 bug[2],这里面提到一句话:

Tried to tweak table_open_cache_instances to affect this?
查询此参数描述:
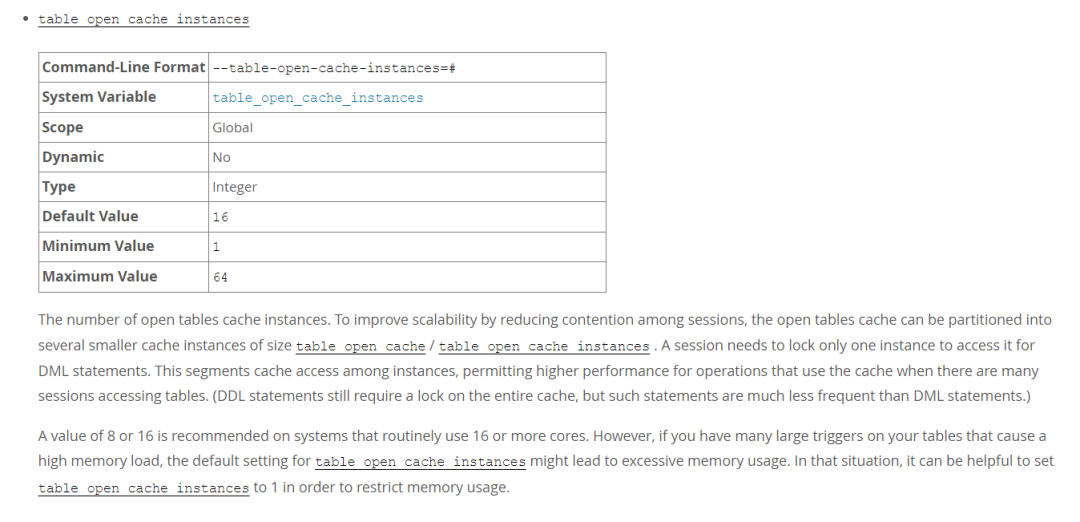
A value of 8 or 16 is recommended on systems that routinely use 16 or more cores. However, if you have many large triggers on your tables that cause a high memory load, the default setting for table_open_cache_instances might lead to excessive memory usage. In that situation, it can be helpful to set table_open_cache_instances to 1 in order to restrict memory usage.
根据官方的解释可以了解到,如果有许多大的触发器,参数 table_open_cache_instances 的默认值可能会造成内存使用过多。
比如 table_open_cache_instances 设置为 16,那么表缓存会划分为 16 个 table instance。当并发访问大时,最多的情况下一个表的缓存信息会出现在每一个 table instance 里面。
再有每次将表信息放入表缓存时,所有关联的触发器都被放入 memory/sql/sp_head::main_mem_root 中,table_open_cache_instances 设置的越大其所占内存也就越大,以及存储过程也会消耗更多的内存,所以导致内存一直上升最终导致 OOM。
下面简单验证一下触发器对内存的影响。
当 table_open_cache_instances 为 8 时:
#清空缓存

mysql> flush tables;
Query OK, 0 rows affected (0.00 sec)

[root@test ~]# cat test.sh
for i in `seq 1 1 8`
do
mysql -uroot -p test -e "select * from test;"
done

[root@test ~]# sh test.sh

mysql> show variables like '%table_open_cache_instances%';
+----------------------------+-------+
| Variable_name | Value |
+----------------------------+-------+
| table_open_cache_instances | 8 |
+----------------------------+-------+
1 row in set (0.00 sec)

mysql> SELECT current_alloc FROM sys.memory_global_by_current_bytes WHERE event_name='memory/sql/sp_head::main_mem_root';
+---------------+
| current_alloc |
+---------------+
| 119.61 KiB |
+---------------+
1 row in set (0.00 sec)
在该表上创建一个触发器。
mysql> \d|
mysql> CREATE TRIGGER trigger_test BEFORE INSERT ON test FOR EACH ROW BEGIN SIGNAL SQLSTATE '45000' SET message_text='Very long string. MySQL stores table descriptors in a special memory buffer, calle
'> at holds how many table descriptors MySQL should store in the cache and table_open_cache_instances t
'> hat stores the number of the table cache instances. So with default values of table_open_cache=4000
'> and table_open_cache_instances=16, you will have 16 independent memory buffers that will store 250 t
'> able descriptors each. These table cache instances could be accessed concurrently, allowing DML to u
'> se cached table descriptors without locking each other. If you use only tables, the table cache doe
'> s not require a lot of memory, because descriptors are lightweight, and even if you significantly increased the value of table_open_cache, it would not be so high. For example, 4000 tables will take u
'> p to 4000 x 4K = 16MB in the cache, 100.000 tables will take up to 390MB that is also not quite a hu
'> ge number for this number of open tables. However, if your tables have triggers, it changes the gam
'> e.'; END|
Query OK, 0 rows affected (0.00 sec)

#清空缓存

mysql> flush tables;
Query OK, 0 rows affected (0.00 sec)
然后访问表,查看缓存。
[root@test ~]# cat test.sh
for i in `seq 1 1 8`
do
mysql -uroot -p test -e "select * from test;"
done

[root@test ~]# sh test.sh

mysql> SELECT current_alloc FROM sys.memory_global_by_current_bytes WHERE event_name='memory/sql/sp_head::main_mem_root';
+---------------+
| current_alloc |
+---------------+
| 438.98 KiB |
+---------------+
1 row in set (0.00 sec)
可以发现 memory/sql/sp_head::main_mem_root 明显增长较大。如果有很多大的触发器,那么所占内存就不可忽视(现场环境触发器里面很多是调用了存储过程)。
当 table_open_cache_instances 为 1 时:
mysql> flush tables;
Query OK, 0 rows affected (0.00 sec)

mysql> show variables like '%table_open_cache_instances%';
+----------------------------+-------+
| Variable_name | Value |
+----------------------------+-------+
| table_open_cache_instances | 1 |
+----------------------------+-------+
1 row in set (0.00 sec)

SELECT current_alloc FROM sys.memory_global_by_current_bytes WHERE event_name='memory/sql/sp_head::main_mem_root';
+---------------+
| current_alloc |
+---------------+
| 119.61 KiB |
+---------------+
1 row in set (0.00 sec)

mysql> #访问表

mysql> system sh test.sh

mysql> SELECT current_alloc FROM sys.memory_global_by_current_bytes WHERE event_name='memory/sql/sp_head::main_mem_root';
+---------------+
| current_alloc |
+---------------+
| 159.53 KiB |
+---------------+
1 row in set (0.00 sec)
可以发现 memory/sql/sp_head::main_mem_root 所占内存增长较小。
由于大量触发器会导致表缓存和 memory/sql/sp_head::main_mem_root 占用更多的内存,根据实际环境,尝试把该从库的 table_open_cache_instances 修改为 1 后观察情况。
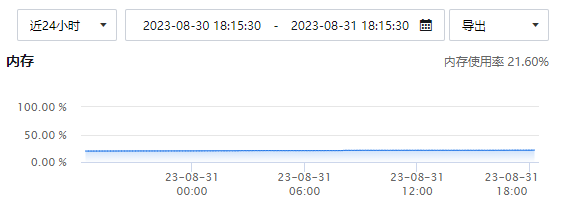
可以看到内存值趋于稳定,未再次出现内存使用率异常的问题。
3总结
-
MySQL 中不推荐使用大量的触发器以及复杂的存储过程。 -
table_open_cache_instances设置为 1 时,在高并发下会影响 SQL 的执行效率。本案例的从库并发量不高,其他场景请根据实际情况进行调整。 -
触发器越多会导致 memory/sql/sp_head::main_mem_root 占用的内存越大,存储过程所使用的内存也会越大。 -
本文只是给出了解决内存溢出的一个方向,具体的底层原理请自行探索。
参考资料
sp_head: https://dev.mysql.com/doc/dev/mysql-server/latest/classsp__head.html#details
[2]86821: https://bugs.mysql.com/bug.php?id=86821
本文关键字:#MySQL# #内存# #触发器# #OOM#
阅读推荐
故障分析 | MySQL 扩展 VARCHAR 长度遭遇问题的总结
技术分享 | 八怪:再谈 MySQL 8 这两个精准的时间戳
关于 SQLE
SQLE 是一款全方位的 SQL 质量管理平台,覆盖开发至生产环境的 SQL 审核和管理。支持主流的开源、商业、国产数据库,为开发和运维提供流程自动化能力,提升上线效率,提高数据质量。
SQLE 获取
网站声明:如果转载,请联系本站管理员。否则一切后果自行承担。
-
 zlj141319 2024-03-13 08:32:46
这很可以
赞同 0 反对 0回复
DIY,越搞越有机。
- 上周热门
- 如何使用 StarRocks 管理和优化数据湖中的数据? 2675
- 【软件正版化】软件正版化工作要点 2640
- 统信UOS试玩黑神话:悟空 2536
- 信刻光盘安全隔离与信息交换系统 2221
- 镜舟科技与中启乘数科技达成战略合作,共筑数据服务新生态 1092
- grub引导程序无法找到指定设备和分区 747
- WPS City Talk · 校招西安站来了! 15
- 金山办公2024算法挑战赛 | 报名截止日期更新 15
- 看到某国的寻呼机炸了,就问你用某水果手机发抖不? 14
- 有在找工作的IT人吗? 13
- 本周热议
- 我的信创开放社区兼职赚钱历程 40
- 今天你签到了吗? 27
- 信创开放社区邀请他人注册的具体步骤如下 15
- 如何玩转信创开放社区—从小白进阶到专家 15
- 方德桌面操作系统 14
- 我有15积分有什么用? 13
- 用抖音玩法闯信创开放社区——用平台宣传企业产品服务 13
- 如何让你先人一步获得悬赏问题信息?(创作者必看) 12
- 2024中国信创产业发展大会暨中国信息科技创新与应用博览会 9
- 中央国家机关政府采购中心:应当将CPU、操作系统符合安全可靠测评要求纳入采购需求 8